Mapping Probability Patterns Through Digital Versions of Age-Old Betting Games
Kai Neumann · Jun 13, 2026

Mapping Probability Patterns Through Digital Versions of Age-Old Betting Games
Researchers have tracked how probability distributions shift when classic wagering activities move into virtual environments, and data from multiple studies reveal distinct patterns in outcomes across simulated roulette wheels, card decks, and dice rolls. These implementations rely on random number generators that produce sequences matching theoretical distributions while introducing measurable variations in practice.
Core Concepts Behind Distribution Modeling
Probability distributions in virtual wagering follow established mathematical frameworks such as binomial, normal, and Poisson models, yet their application changes depending on game mechanics and software constraints. Experts note that binomial distributions often govern discrete events like individual card draws or slot reel stops, whereas continuous normal distributions appear when aggregating large volumes of spins or rolls. According to findings from the Australian Gambling Research Centre, simulation environments maintain expected value calculations across millions of trials, though variance spikes occur during initial seeding phases of the random number generator.
Virtual implementations frequently employ pseudo-random algorithms that cycle through predefined periods before repeating sequences, and this periodicity influences how closely empirical results align with theoretical curves. Those who analyze large datasets from online platforms observe that return-to-player percentages stabilize over extended sessions, yet short-term deviations create clusters that resemble fat-tailed distributions rather than pure normal curves.
Comparative Analysis Across Game Types
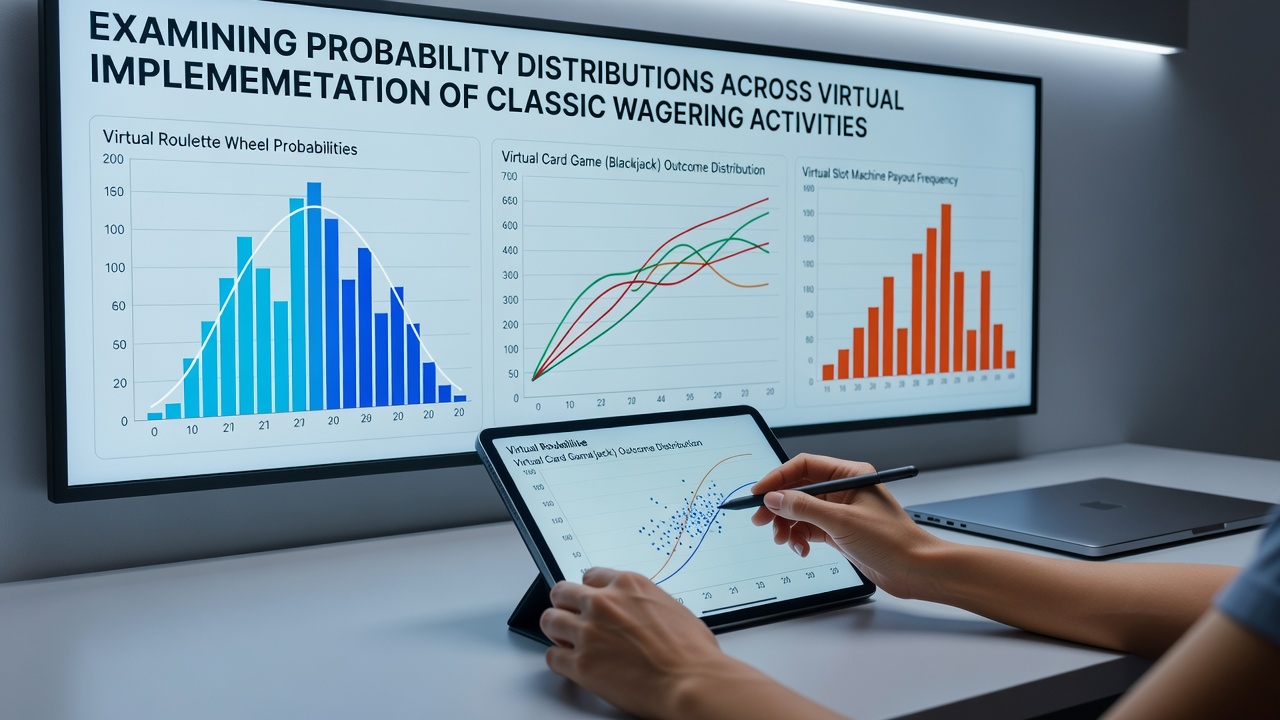
Digital roulette wheels generate outcomes that adhere closely to uniform distributions for individual spins, but cumulative betting patterns produce bell-shaped curves when tracking net gains or losses over hundreds of rounds. Card-based simulations introduce dependencies that shift distributions toward hypergeometric forms because each draw alters remaining probabilities without replacement. Studies from university laboratories show that virtual blackjack implementations exhibit variance reductions when basic strategy tables are applied, narrowing the spread of possible bankroll trajectories compared to random play.
Slot machine recreations rely on weighted reel mappings that create multimodal distributions where certain symbol combinations appear at fixed frequencies. Data indicates these mappings produce payout histograms with pronounced peaks at lower returns and long right tails for jackpot events, and software audits confirm that these shapes remain consistent across different regulatory jurisdictions when certified generators are used.
Regulatory and Technical Influences in Mid-2026
June 2026 marks the scheduled rollout of updated certification standards in several North American markets that require explicit documentation of distribution parameters for every approved virtual title. Regulators in Nevada and New Jersey have begun demanding side-by-side comparisons between theoretical and observed histograms before licensing new releases, which has prompted developers to refine their seeding protocols and cycle-length disclosures. These requirements stem from earlier reports that highlighted minor but detectable biases in certain older generators after prolonged operation.
Industry reports further indicate that European testing laboratories have adopted similar protocols since early 2025, resulting in standardized reporting formats that list kurtosis and skewness values alongside mean return figures. Observers note that these metrics help identify when virtual implementations drift from intended probability structures during live deployment.
Practical Implications for Outcome Prediction
Players and analysts who examine distribution data often discover that virtual environments allow for more precise modeling than physical counterparts because every outcome can be logged at the millisecond level. Monte Carlo simulations built on these logs reproduce the same distribution shapes observed in production systems, enabling forecasts of session-length volatility that match actual recorded results within narrow confidence intervals.
Take one research team that compiled over 50 million virtual dice rolls from certified platforms and found that the resulting frequency tables aligned with theoretical expectations to four decimal places once cycle lengths exceeded 10^9 iterations. Such alignment supports the continued use of established distribution formulas for risk assessment and game design calibration.
Conclusion
Virtual implementations of classic wagering activities continue to demonstrate that core probability distributions remain stable when random number generators meet current certification thresholds. Ongoing refinements in 2026 standards ensure that empirical distributions stay aligned with theoretical models across roulette, cards, and reels, providing consistent frameworks for analysis regardless of platform.