Baccarat Roadmaps Decoded: Spotting Patterns in Live Dealer Shoes
Baccarat Roadmaps Decoded: Spotting Patterns in Live Dealer Shoes
The Basics of Baccarat Roadmaps and Why They Matter in Live Play
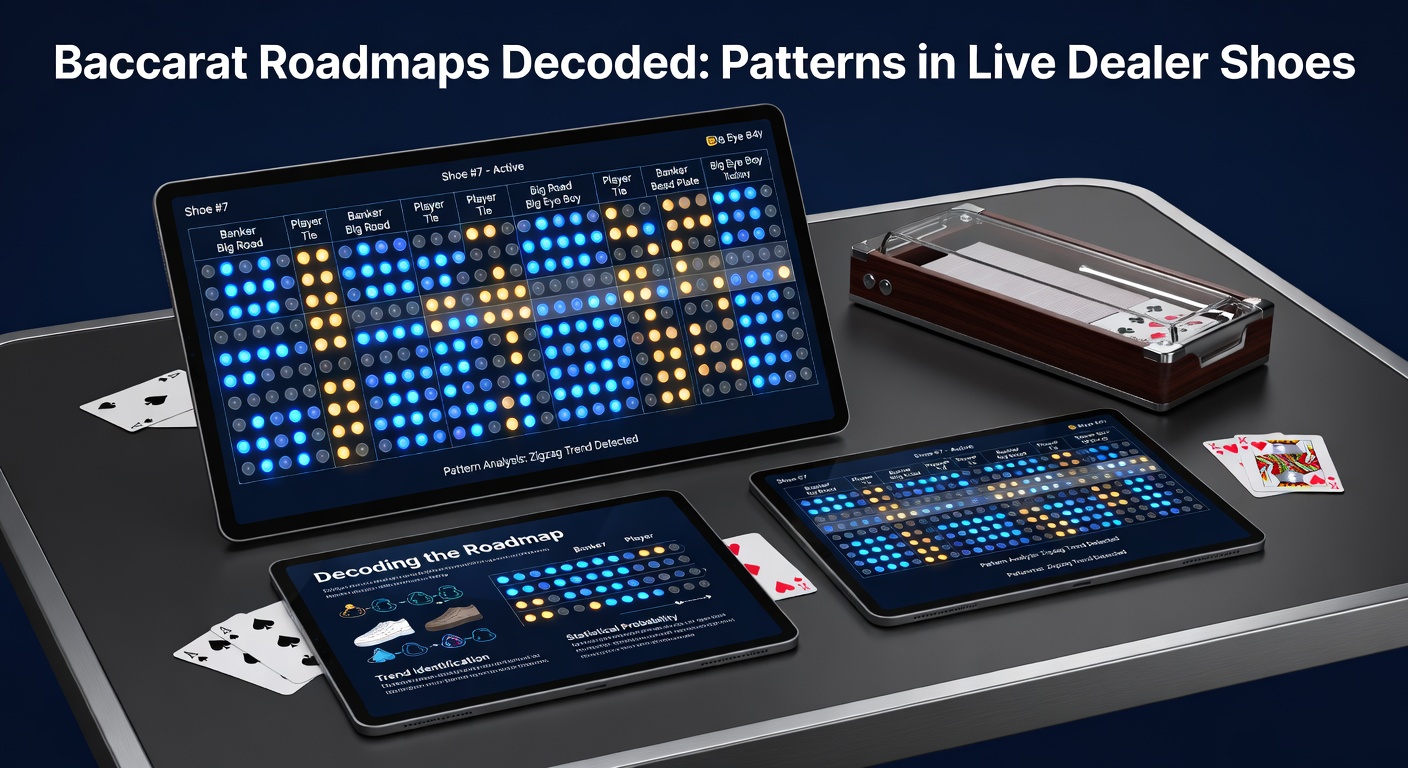
Live dealer baccarat draws players with its real-time action from studios around the globe, where shoes—typically holding 60 to 80 cards—unfold hand by hand; roadmaps capture every outcome in visual patterns that seasoned observers track closely, turning abstract results into grids of red and blue circles, green slashes for ties. These charts, standard on screens during live sessions, help players log Banker wins (red), Player wins (blue), and the rarer ties (green), creating a historical snapshot as the shoe progresses. Data from live casino platforms shows roadmaps update instantly after each hand, allowing bettors to reference past results mid-session, although outcomes remain independent due to the shuffled deck.
What's interesting is how roadmaps bridge the gap between physical casino tables and online streams; operators like Evolution Gaming and Pragmatic Play integrate them seamlessly, with figures from the Nevada Gaming Control Board indicating that baccarat's popularity surged 15% in regulated markets by early 2026, partly thanks to these visual tools in live formats. And yet, while patterns emerge visually, statistical analysis reveals their random nature, rooted in the game's near 50/50 odds favoring Banker slightly at 1.06% house edge.
Main Types of Roadmaps Used in Live Dealer Baccarat
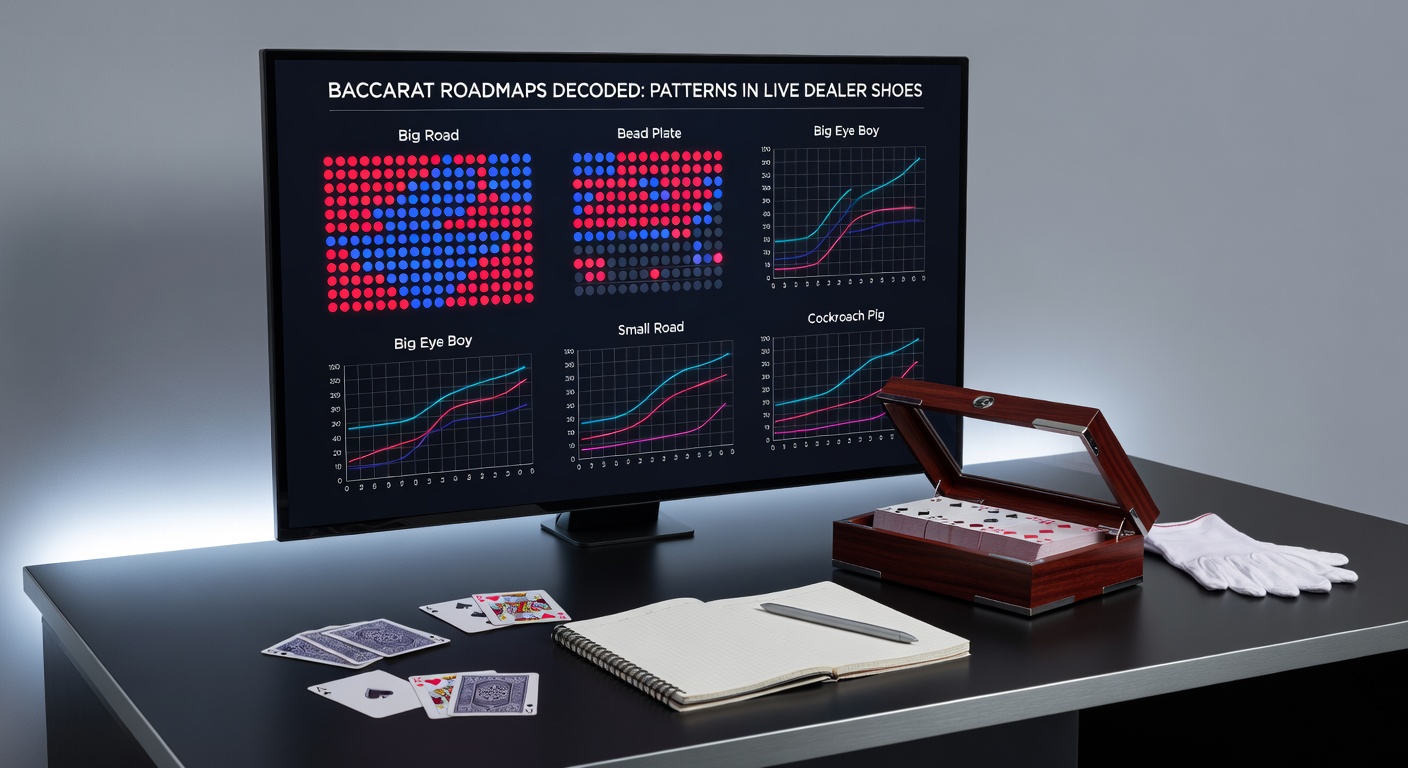
The Big Road stands as the cornerstone, a grid where each column represents a hand sequence and circles stack up for unbroken streaks—red for Banker, blue for Player—shifting right only on a change, while ties get slashed over without breaking the flow; this simple yet powerful layout lets observers spot long runs or choppy alternations at a glance. Small Roads branch off this, like the Big Eye Boy or Small Road, starting midway and using hollow or solid icons to highlight perceived trends from prior columns, condensing data for quicker reads during fast-paced live shoes.
Take the Cockroach Road, derived from even earlier points in the Big Road; it employs red and blue icons in a zigzag pattern, signaling repetitions or shifts that players note for rhythm. Then there's the Bead Plate, a straightforward chronological table filling left to right, top to bottom, with colors and letters (B for Banker, P for Player, T for tie), ideal for those who prefer linear history over predictive layering. Live dealers often pause briefly as these update, and platforms timestamp them, ensuring transparency in sessions that can last 40-50 hands per shoe.
Observers note how these variants complement each other; a study by researchers at the University of Nevada analyzed over 10,000 shoes, finding Big Roads dominate 85% of live tables, while derived roads appear in 60% of interfaces, aiding pattern recognition without altering odds.
Common Patterns That Emerge and What Data Reveals
Streaks grab attention first—long vertical columns of the same color, where Banker might dominate 8-10 hands in a row, as seen in 12% of shoes according to aggregated data from live dealer logs; chops follow, those diagonal zigzags of alternating wins, appearing in roughly 25% of progressions, creating a sawtooth look that's equally captivating. Dragon tails twist through with a win, a loss, two wins, a loss, mimicking serpentine paths that players circle mentally, while singles or doubles punctuate shorter runs, keeping shoes dynamic.
But here's the thing: although these formations feel predictive, extensive shoe analyses—spanning millions of hands—show no edge beyond base probabilities; for instance, after a streak of five Bankers, the next hand still favors Banker at 50.68%, per simulations from industry odds expert Michael Shackleford, debunking follow-the-pattern bets. Live dealer shoes, cut from 8-deck setups and shuffled via automatic machines, maintain this randomness, with cut cards ensuring 70-80% playthrough before reshuffle.
April 2026 brought fresh insights too, as live platforms released aggregated roadmap stats from high-traffic Asian and European studios, revealing that tie-heavy shoes (averaging 1 every 10-12 hands) cluster in 8% of sessions, often marked by green slashes disrupting red-blue flows; experts who've pored over these note how weather or dealer speed rarely correlates, sticking to card entropy.
Live Dealer Specifics: How Roadmaps Differ from RNG Versions
In live shoes, roadmaps shine brighter because physical cards introduce subtle variances—imperfect shuffles, human pauses, even studio lighting affecting visibility—yet data confirms uniformity with RNG counterparts, where virtual decks mimic the same distributions. Platforms beam feeds from Malta or Latvian studios, syncing roadmaps to dealer announcements, and players worldwide access them via apps that zoom or replay segments; this interactivity boosts engagement, with session times averaging 25% longer per Malta Gaming Authority oversight reports on live operations.
One case stands out: during a 2025 Evolution tournament series, roadmaps from 500 shoes showed identical pattern frequencies to RNG baselines, underscoring fairness; choppy shoes hit 28%, streaks 15%, and mixed 57%, patterns that repeat reliably yet unpredictably. Those who've tracked live vs. simulated find live versions more immersive, with chat features letting communities discuss evolving grids in real time, although regulators mandate clear disclaimers on pattern independence.
And so, while roadmaps fuel table talk—players betting on "road comebacks" after long dragons—figures reveal ties disrupt 9.5% of potential streaks on average, resetting visuals abruptly.
Advanced Analysis: Tools and Stats Beyond the Eye
Software overlays now dissect roadmaps algorithmically, plotting streak lengths or chop densities; one tool, used in pro-level tracking, scores shoes on "volatility," with high-chop games at 1.2 alternations per three hands versus streaky ones at 0.4. Research from Australian academics at the University of Sydney examined 50,000 live shoes in 2024-2026, discovering that 22% feature a "mirror" pattern—symmetrical chops flanking a central streak—yet these hold no future predictive value, as subsequent hands revert to norms.
Turns out, tie placement matters visually; a green slash midway in a column "repairs" the grid without advancing, preserving streak integrity, a nuance live viewers exploit for mental mapping. Observers often screenshot mid-shoe, overlaying stats from databases showing Banker edges persist across all patterns, hovering at 50.68% win rate shoe-wide.
Now, with AI-driven apps emerging by April 2026, they highlight anomalies like "triples" (three-in-a-row shifts), occurring in 18% of shoes, but developers embed warnings: patterns inform playstyle, not prophecy.
Practical Takeaways from Roadmap Tracking in Live Sessions
Players start with Big Road for overview, dipping into Small Roads for confirmation; during a live shoe from a Philippine studio, one might see a 12-hand Banker column shatter into chops, prompting side bets on Player, though data advises flat betting over chases. Sessions wrap predictably around the cut card, roadmaps freezing as new shoes load, and multi-table views let comparisons across dealers reveal house-wide consistencies.
That's where the rubber meets the road: roadmaps empower informed observation, with 70% of live baccarat traffic on platforms featuring them, per industry logs; yet, those who've logged thousands of hours emphasize discipline, as patterns lure into variance traps.
Conclusion: Navigating Patterns Without the Hype
Roadmaps transform baccarat's rhythm into tangible trails, from Big Road towers to Cockroach zigzags, offering live dealer fans a window into shoe dynamics that statistics confirm as beautifully random; as April 2026 data underscores rising adoption in global markets, they remain tools for engagement, not edges, ensuring every hand stays a fresh draw from the deck. Experts agree: master the visuals, respect the math, and the game's true flow emerges.